
File:Maxwell Dist-Inverse Speed.png
Summary
[edit]
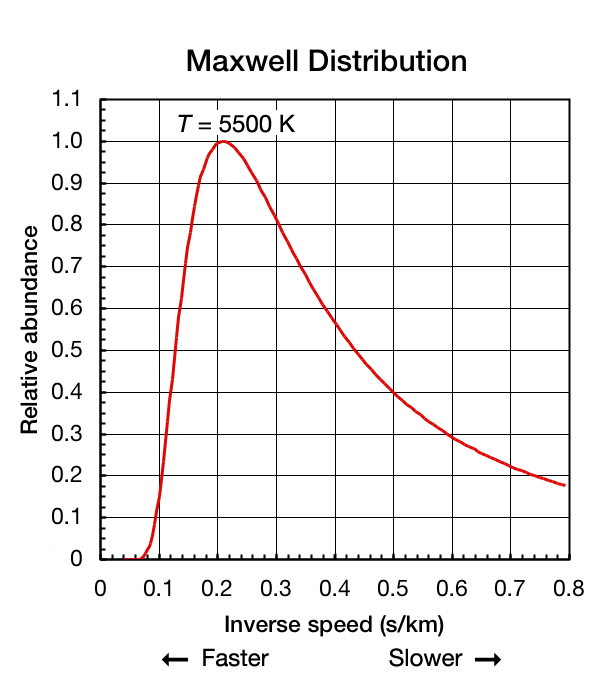
This graph shows the Maxwell distribution of helium atom speeds at 5500 kelvin. The speeds are shown as inverse speed so one can more easily compare this shape to that of a Planck curve. In this graph, the left end of the X-axis represents higher energies and higher speeds. Greg L 03:14, 4 August 2006 (UTC)
Licensing
[edit]

This licensing tag was added to this file as part of the GFDL licensing update.
If possible, please upload a PNG or SVG version of this image, derived from a non-lossy source so that it doesn't contain any compression artifacts (or with existing artifacts removed). After doing so, please replace all instances of the artifacted version throughout Wikipedia (noted under the "File links" header), tag the old version with
{{obsolete|NewImage.ext}}, and remove this tag. For more information, see Wikipedia:Preparing images for upload.History of Image:Maxwell Dist-Inverse Speed.jpg
[edit]
- 2007-12-06T13:13:44Z Keenan Pepper (Talk | contribs) (406 bytes) ({{BadJPEG}})
- 2007-05-09T15:51:24Z Cydebot (Talk | contribs) (396 bytes) (Robot - Fixing GFDL tags project-wide per [[Wikipedia:GFDL standardization]].)
- 2006-08-04T05:16:08Z Greg L (Talk | contribs) (/* Summary */)
- 2006-08-04T03:14:03Z Greg L (Talk | contribs) (This graph shows the Maxwell distribution of helium atom speeds at 5500 kelvin. The speeds are shown as ''inverse'' speed so one can more easily compare the shape of the Planck curve, which has shorter wavelengths (higher energies and associated speeds))

Any user may perform this transfer; refer to Wikipedia:Moving files to Commons for details.
If this file has problems with attribution, copyright, or is otherwise ineligible for Commons, then remove this tag and DO NOT transfer it; repeat violators may be blocked from editing.
- Endorse this file for transfer by adding
|human=<your username>to this Template. - If this file is freely licensed, but otherwise unsuitable for Commons (e.g. out of Commons' scope, still copyrighted in the US), then replace this Template with
{{Do not move to Commons|reason=<Why it can't be moved>}} - If you think that a local copy of this file should be retained, then replace this Template with
{{Keep local|reason=<Why a local copy is needed>}} - Please ensure that the file has a properly descriptive and unambiguous name before transferring; see Wikipedia:File mover#What files should be renamed? for details.
File history
Click on a date/time to view the file as it appeared at that time.
| Date/Time | Thumbnail | Dimensions | User | Comment | |
|---|---|---|---|---|---|
| current | 02:10, 22 July 2008 | | 600 × 700 (71 KB) | 718 Bot (talk | contribs) | == Summary == This graph shows the Maxwell distribution of helium atom speeds at 5500 kelvin. The speeds are shown as ''inverse'' speed so one can more easily compare this shape to that of a Planck curve. In this graph, the left end of the X-axis represe |
You cannot overwrite this file.
File usage
The following 3 pages use this file: